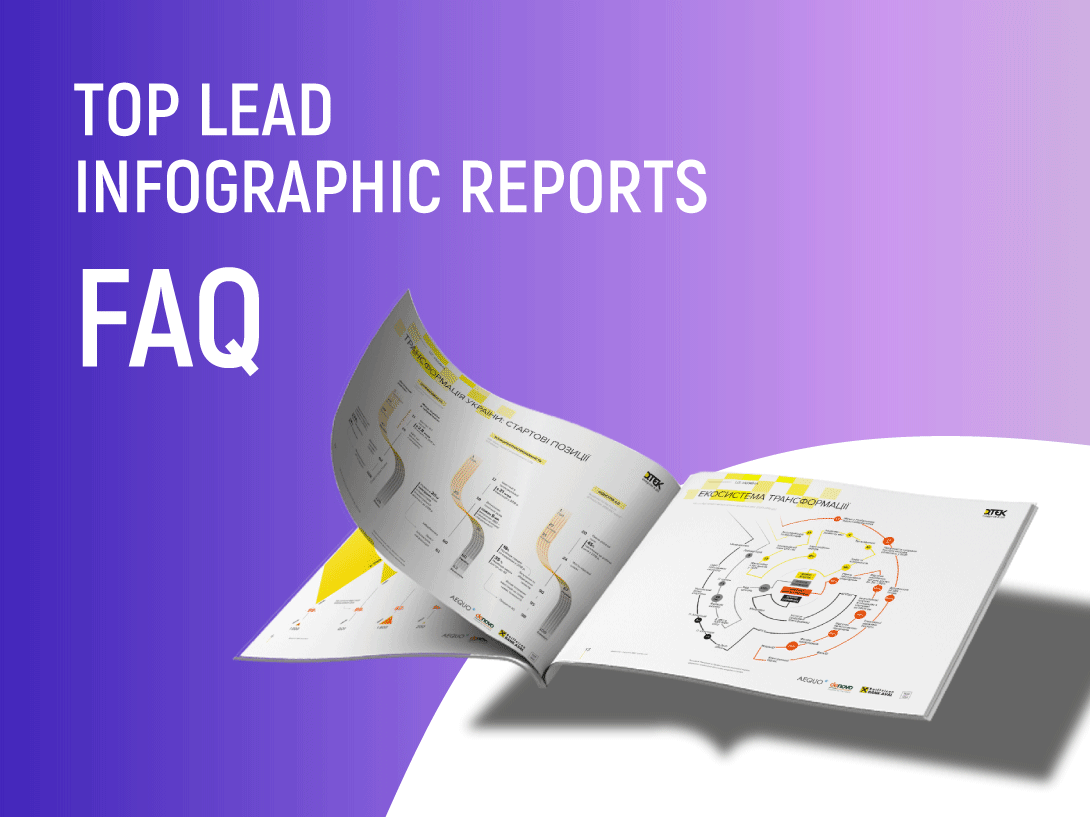
Top Lead Infographic Reports FAQ
What is an infographic report?
An infographic report is a special project dedicated to any individual industry of the Ukrainian economy. It consists of an electronic version in PDF format and a glossy printed version.
Reports (or infographic guides/ industry guides) are usually dedicated to industries that can be more difficult to understand like pharmaceuticals, energy, IT, cryptocurrencies, and agribusiness. The main purpose of an infographic report is to break down these industries and make them more accessible for a wider circle of people.
Guides answer questions about how an industry is structured, break down the different elements it is comprised of, explain how that sector interacts with other sectors of the economy, outlines which prevailing trends are worth attention, where the opportunities for growth are, what problems need to be overcome, and where Ukraine ranks in the world based on output for that particular industry.
Is this not just another report?
No. It"s common practice to publish reports based on any area of a country"s economy. Often though, these reports are muddled collections of tables and texts which can generally only be understood by experienced analysts and industry experts.
We have a lot of infographics.
Our reports are made using a completely different approach — they explain one or another branch of the economy in a way that even a person with no relevant experience can understand it.
For this, we present the data in infographics. We use next to no text at all and any data are delivered as infographics. Only completely necessary sentences remain in the report, but even they are presented clearly and concisely.
We structure information and place emphasis on the important stuff.
We don"t just dump mountains of data onto a reader and change the colour of the font. Our reports are not waste paper; they won"t be used to make paper aeroplanes when the office intern gets bored nor will they be used to wedge a wobbly desk.
Each and every time we start working on a new guide, we decide which information is really important, and which can be omitted without damaging the integrity of the information presented.
In each infographic report, we highlight important accents and look at familiar numbers from unexpected angles — we interpret relationships, offer explanations, and draw conclusions.
Why are the reports infographic?
Studies show that people perceive and remember images much better than text. Colour visualisation increases the desire to see material by 80%. A person only remembers 10% of what they hear, just 20% of what they read, but a huge 80% of what they see. If instructions are accompanied by illustrations, then they are 323% more effective than without.
Thus, visualization is the best way to convey important information to a target audience and to encourage them to remember information.
What makes these reports unique?
Our concept is maximum data visualization.
We have been making infographic guides since 2014 and now we produce several guides a year on different topics. During this time, we have seen a huge number of different reports from other companies. The disadvantage of the majority is that they do not convey information simply enough.
We make reports in an infographic format to simplify the perception of complex topics as much as possible. We receive glowing reviews from our clients, with particular gravity placed on the point that our reports have helped to deconstruct previously incomprehensible topics into coherent, palatable chunks.
At the moment, no one in the world produces completely infographical educational products about complex industries.
Why are your guides in demand on the market?
They are simple, comprehensible, and give an unparalleled picture of how a particular industry is structured and how the market works.
Each report is an educational project, designed to convey important messages about various aspects of an industry, to talk about complex processes in plain language, and to bust myths that involved in these sectors of the economy.
Guides are an excellent promotional tool, demonstrating the capabilities of Ukrainian companies to potential foreign partners.
Have you done similar reports before?
Yes, and regularly. We have tailor made reports for a wide range of industries such as agribusiness, IT, energy, pharmaceuticals, agricultural exports, budget, taxes, fintech, the food industry, and many more.
(Click on the cover to download the guide. You can see the full list of our guides here)
And what are the results?
Contacts of potential clients. The Infographic Report "Energy industry in Ukraine" has collected 2500 contacts of potential customers. "Agribusiness in Ukraine" collected 4000 different contact leads.
Views associated with the partner"s brand. Promotional materials and a page for downloading the report in which partners are mentioned received hundreds of thousands of views.
Mentioning in the media. Materials from the Report "Pharmaceutical Industry in Ukraine" were published on the websites "Apteka.ua," "Korrespondent", "Finance.ua", "LB.ua" and others. The magazine "Novoe Vremya" published infographics from the directory on their website.
Creating the image of an expert. Baker Tilly, which has been supporting the agribusiness directory for five consecutive years, acquired the image of the largest auditor for agricultural companies in Ukraine.
Who are the partners?
Partners are the companies that are interested in the publication of a report and support its publication.
How do companies support a report?
They support it financially and can also demonstrate their own expertise within a report.
Has someone already supported your reports?
Yes. Pharmaceutical firm Darnitsa, law firm Aequo, DTEK, ACC in Ukraine, Baker Tilly, Credit Agricole, Bosh, Henry Blazer, IDC, SIBIS, Aval, and FUIB.
Why is it worth becoming a partner for a report?
- The report will enhance your brand awareness.
- You can demonstrate your expertise in the market.
- You will become the leader in a certain information space.
- It is an effective communication tool that allows you to convey important messages about a company to the audience.
- You will get the opportunity to attract new customers by directly and accurately targeting relevant audiences.
- You will be able to engage and educate potential customers.
- Reports demonstrate the capabilities of Ukrainian companies to foreign partners.
What exactly will I get as a partner?
- Your brand logo on the pages of the report and a page for downloading the report.
- Mentions in other promo materials (at least 5 publications).
- An expert page specifically designed for you, which will demonstrate your unique expertise in specific fields, like legal and analytical. This will be a page full of useful content, rather than a simple advertisement. Each page will be discussed and perfected individually. We will help to find the information that best demonstrates your expertise, and discreetly include it within the report.
- The report is a source of unique infographics. It fulfills an educational function, demonstrates the position of your company, and serves other marketing purposes. You will be able to parse the directory page by page and publish individual pages on your website, in a blog, or on social networks — using them to promote your own products and projects. One report typically consists of 20-30 pages, providing regular sources of content for months into the future.
- Contacts of all those who downloaded the report, with the potential for them to become customers.
- An event for journalists and experts where the report is presented.
- Premium print version for presentation purposes with however many copies you deem suitable.
Are these terms typical for everyone or can we discuss them individually?
We can discuss all the terms individually and build cooperation in a way that is comfortable for all parties.
When should I become a partner of a directory?
- If you want to get ahead in a market, you can set the tone for public and professional discussion.
- If it is important for your business model to educate customers.
- If you need to shorten your customer journey through the funnel.
- If you have important messages that you want to effectively convey to your target audience.
- If you possess unique analytical information and need an effective way to present it.
- If your business model is built on the creation of high-quality analytics, and you need to pack it in a presentable format.
- If you want to make a strong statement about yourself in Western markets (almost every report has an English version).
And will I definitely get the contacts of potential customers? How many?
Everyone who downloads the directory leaves their contact information: name, company name, email address, and phone number. We will then pass them on to partners. Depending on the topic of the report, you can count on between 500 and 4000 contacts.
How will I get my brand reinforcement and opinion leader status?
Since your brand is associated with a report, you will be able to position yourself as the expert within an industry. In turn, this increases confidence in your brand among managers of other companies who make decisions about cooperation with partners, contractors, and procurement.
You will be able to formulate an information agenda. The report is an effective tool for setting the tone of discussion in a market and for highlighting important industry trends, problems, and opportunities. The status of a partner allows you to effectively highlight and reinforce your position by asserting your brand in the information space.
The guide is a source of high-quality content that attracts media attention to a brand, helping you set trends for discussion and maintaining that discussion to a high level.
What restrictions does partner status impose on me?
None. Almost. You can use the entire report and its individual pages for any purpose. However, there are simple limitations that exist but they have logical explanations.
You cannot edit or modify the pages of the report or its individual elements. The copyrights on the report are owned by Top Lead LLC, and we only ask to respect these rights.
Also, you can"t post a direct link to the PDF version on your website or in social networks, you can only post a link to the download page. This is necessary in order not to disrupt the process of collecting contact information of users who will download the directory. Contact data is collected on the download page.
Is the report for sale? How do you distribute it?
The electronic version is available for download for free on the download page. Anyone who has left their contact information can download it.
The print version is received by partners. They can distribute it without restrictions at their own discretion, like at conferences and business meetings.
What reports do you plan to release in the future?
We are working on the re-releasing guides that have already been published as well as on releasing new guides about different sectors like cryptocurrencies, and digital transformation.
(Click on the cover to apply for a guide)
Every year we publish new editions of all our reports in order to provide readers with the most relevant information and a fresh look at an industry. You can become a partner of any directory, even if you haven"t cooperated with us before. You can find out more details by emailing manager@toplead.com.ua
Can I order a guide on a specific topic?
Yes. To do this, email manager@toplead.com.ua
How much does it cost to become your partner?
The cost of each report is calculated individually. For more details, email manager@toplead.com.ua.
Who is working on the guide?
A team of managers, editors, analysts, and journalists. We are professionals in data visualization. Our team has produced many reports, annual reports, presentations, and other content that has helped our clients to better explain themselves. You can learn more about our work here.
When working on each report, we communicate with industry experts who help us to better understand the market, the trends, and where emphasis should be placed.
How long does it take to create a Report?
It can take anywhere from a couple of months to six months. It all depends on the complexity of the topic and whether we already have something in the pipeline, like a new guide or a new edition of a previously released guide.
Who are the readers of the guide?
Above all, the readers are middle and senior managers who need a full picture of a market and its individual components in a comprehensive, comprehensible format. For a partner, this means that your brand will be associated with a reliable source of information.
The guide will also be read by the media and other industry experts. For them, the directory is a source of relevant content. For a partner, this means the ability to set information trends.
In addition, our reports are read by people who are simply interested in a particular industry; those who need to quickly access analytical data. For a partner, this gives the opportunity to answer their questions and to increase customer loyalty.
Why do readers need a guide?
Often, even a company's management needs an independent source from which they can quickly understand the state of a market where a company operates, as well as other related markets.
The report is an authoritative source of relevant and well-structured information that can be relied on in negotiations and which can be used in the preparation of other analytical reports within a company.
It helps to establish effective communication with existing and potential customers who might not be experts within the industry in which your company operates, and could be vulnerable to exploitation by unscrupulous competitors.
How do you make a report?
First, we study the market and its needs for analytical information. After this stage, we already have an understanding of who has done which reports and how we can present the information. At the same time, our team understands which aspects of the industry need the most attention.
Next, we collect analytical information and understand the trends. We use data from open sources and insider information from partners and experts.
After collecting this information, we structure it. We then have a final understanding of what is important for a particular market and from which angle we need to cover a particular problem. Finally, we place the relevant emphasis on the points that need it.
The next step is visualization. We pay huge attention to how we can effectively visualize something in order to convey information as simply and as clearly as possible.
Are the data sources accurate?
We take data from official sources: both Ukrainian and international. We also use data from our partners who are analytical companies.
Our analysts carefully study and analyze the data. We often encounter discrepancies in data from different sources and realise that not all sources that position themselves as reliable are. Therefore, we are constantly on our toes and making decisions about whether information can be used in a report.
We are wholly committed to providing readers with quality, trustworthy analytics.
I want to show my company in a profitable way. How much would it cost?
We do not lobby the interests of individual companies, we do not embellish facts, we do not bleach images, and we do not hide uncomfortable facts. Therefore, we will not publish anything that we deem misleading or deceitful.
The interests of our partners should coincide with ours. In preparing the guides, we want to truthfully demonstrate the state of the industry, point out problems to give an impetus to their solutions, show opportunities for growth, and educate audiences.
Therefore, we do not distort information to order.
If you have questions or want to become a partner of the report, feel free to write to manager@toplead.com.ua