How to Make Cheeky Infographics
Infographics came in all shapes and sizes, meaning there are certain rules and requirements for their creation. The first step to successful data visualization lies in choosing the right infographic to suit your business" needs.
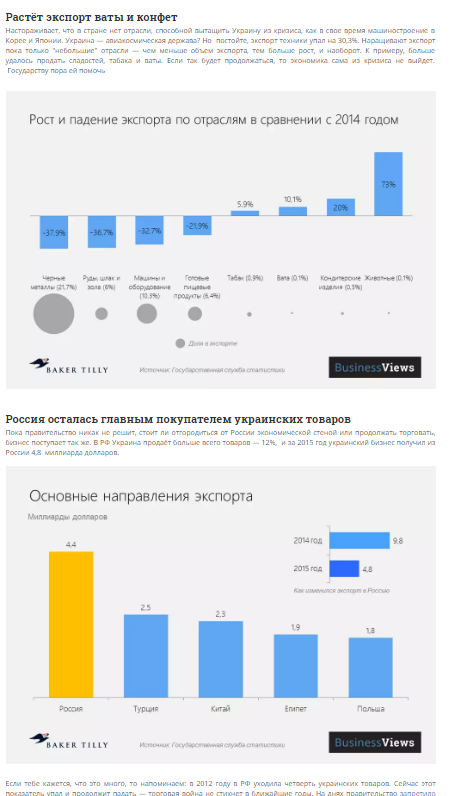
Charticles encourage a reader to read to the end
Charticles combine graphics, text, and images; replacing an analytical article with several pages. Where visual elements are used to simply dilute text in a "regular" article, in a charticle they are the main component and focal point. A chart should contain in-depth analyses of data, converted and exhibited in visual form. Furthermore, it should include text from the article, divided into semantic blocks, and images that directly relate to the topic.
Taking a visual approach allows the writer to surprise the reader, helping the latter take notice of information that regularly goes unnoticed. People do not have the time or energy to write or read long, complex articles. Using visual stimulation, you quickly communicate complex information to a reader.
Charts are especially effective when publishing reports. The word "report" is enough to send shivers down anybody"s spine, with flashbacks to spending several tedious hours analysing the same data from the same 100-page document. Charticles are a great way to break down this tedium, immediately capturing the attention of readers with engaging, interesting information.
But, creating an efficacious chart can be a laborious process. In fact, preparing a chart takes much more time than it takes to express the same idea in writing. Effective charting is a great way to improve your company"s image and attract new customers. A combination of visual material and text offers a satisfying experience for fans of both visual and textual forms of information.
Infographic reports attract new customers
Obviously, it takes a lot longer to prepare a large report. With this in mind, it"s a good idea to ask yourself whether it"s worth all the time and effort when the document will only be looked at once or twice a year, if that. Reports are often saturated with huge amounts of data, which can be a daunting, even uninteresting, task for any reader whenever it is published.
If you take a creative approach to prepare a report, you will reap the rewards at the end of the process. Finding new ways to present your information in infographics, instead of dozens of boring tables, can create a useful, interesting, and aesthetically pleasing result. Reports tend to be overwhelmingly big because businesses follow the same, tired concept of "more is more". Think of all the time you can save; take the poor trees into account that get felled the next time you are printing a document that nobody really wants to read. With the help of infographics, a report can be compressed down to several pages without losing any information. Even a 20-page table with a vast array of data can be expressed in a one-page infographic. Colleagues, peers, and even management will perceive an infographic much more positively; new customers will be attracted.
Here is an example of a major project in which an agricultural report with very agriculture-specific information was transformed into an easy-to-read infographic guide:
Videography is most easily perceived
Some people think that a successful video needs to be as short as possible; others might think that the ideal length of a video is about two minutes. The truth is, such restrictions are only applicable to advertisements or music videos. A video can go on as long as it arouses the interest of the viewer. The main thing is to create a clip with a suitable pace and direction, whilst also making it aesthetically pleasing and informationally saturated.
These days, video dominates above everything else across social and other forms of media. It"s easy to explain from a psychological point of view: video is simply easier to take in. Viewers read the information whilst being entertained at the same time.
The downside of video is that it can be quite expensive to make. Therefore, if a company does decide to invest in this particular marketing strategy, they should make sure that the content is high-quality and engaging. The better a video is, the more likely it is to go viral and attract new customers to a business.
A video can go on for as long as it arouses the interest of the viewer
Infographics greatly simplify communication between a business and a potential client. They allow a person to easily and conveniently understand complex information; working much more effectively than long, monotonous, tedious articles. A modern person does not have time for such opuses, because they have tonnes of information dumped on them every minute.
Nonetheless, even if you do decide to present every single trinket of information in an infographic there is, of course, the risk of it not working. Visually weak or overly complex infographics can seriously damage a brand"s reputation. The main rule of a good infographic is the simplicity of design and the clear presentation of information. However, this simplicity can be complex to achieve. Any designer will preach this irony, because it can be difficult to obtain such integrity whilst being original. Overcoming this can mean your infographic will really catch on.
Want to see cheeky infographics? Look at some examples in our portfolio.