Don't make huge reports, prepare one infographic! 7 examples of laconic content for communications
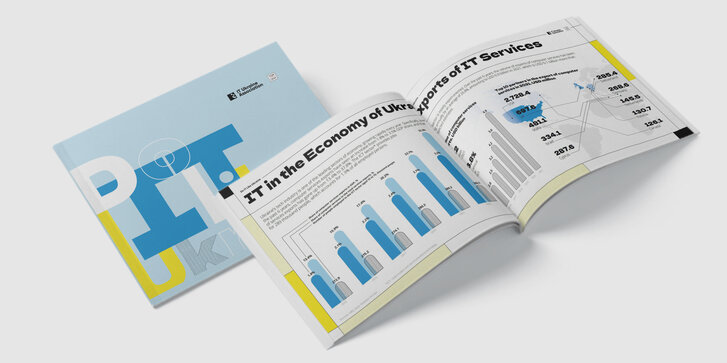
1. A bank that wants to attract customers from the IT industry
The traditional (but not always correct) approach: a large presentation of your services, an annual report of several hundred pages.
Laconic approach: 2 pages of portfolio in the relevant research.
In 2023, we prepared Do IT Like Ukraine, a study of the state of Ukraine's IT industry during the war. Ukrsibbank, one of the largest banks in Ukraine, became a partner of the study and presented its portfolio in the study, showing its market share, the number of clients from the IT industry, and the list of services.
This research was distributed with the help of the IT Ukraine Association and covered by specialized media, so the pages dedicated to Ukrsibbank definitely reached potential customers.
2. An investment company looking for clients
The traditional (but not always correct) approach: many lengthy meetings, most leading to nothing.
A laconic approach: a 7-page infographic brochure.
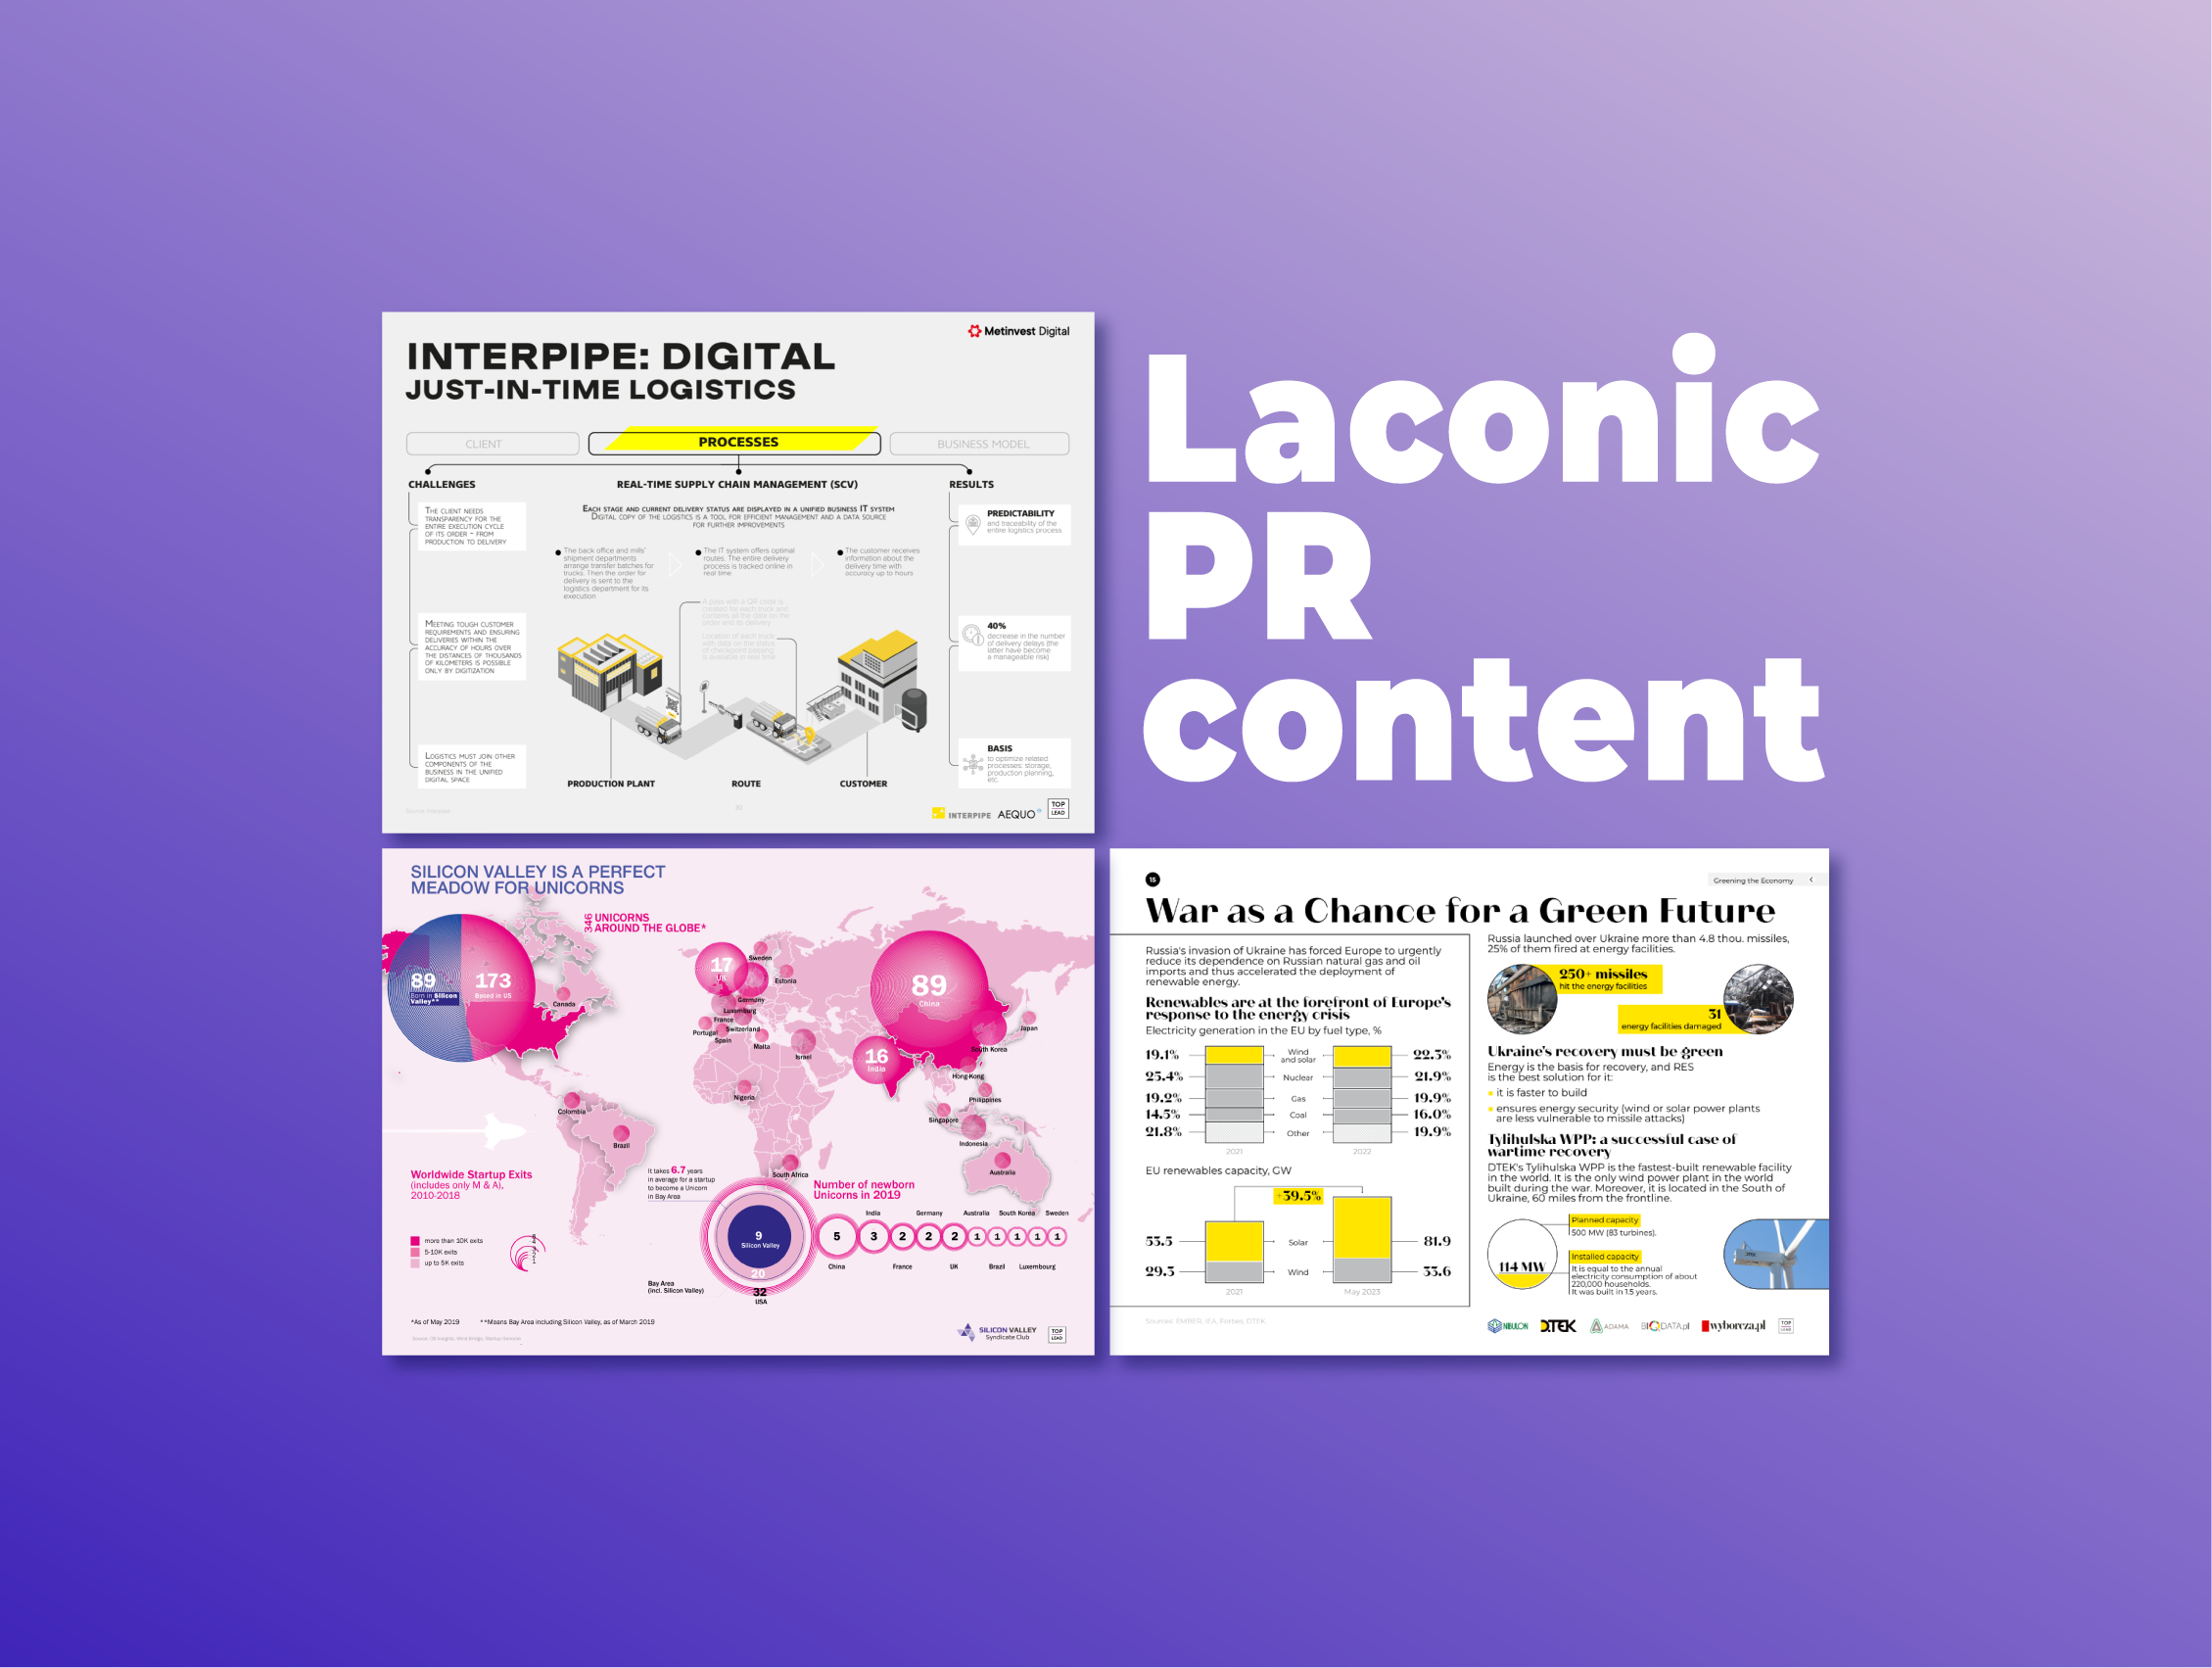
Silicon Valley Club invests in startups in Silicon Valley. We have prepared a bright, brief, convincing brochure, "5 Reasons Why You Should Invest In Silicon Valley", which shows a potential investor the opportunities offered by the Valley.
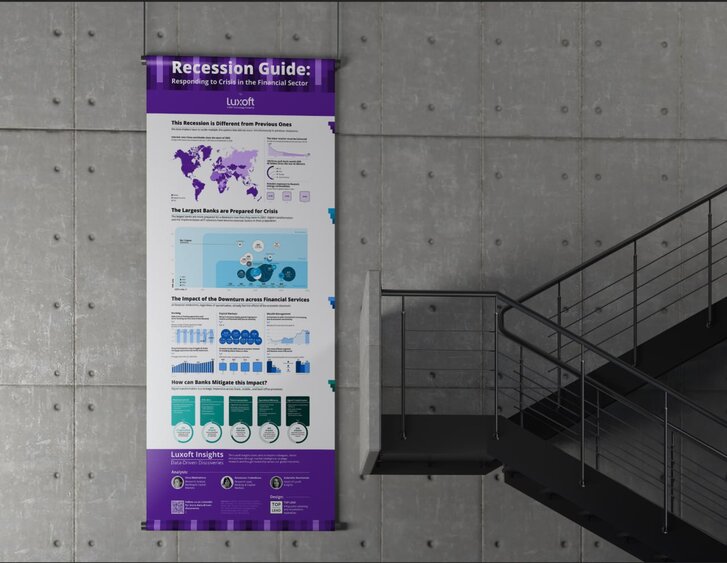
3. The crisis forced an energy company to change the format of communications with customers
Yasno is one of Ukraine's electricity suppliers. You may have seen in the news how Russia shelled Ukraine's energy infrastructure in the fall of 2022 and winter of 2023. Energy companies had to introduce a schedule of outages. One of the consequences was an increased load on the call center and social media: people asked when the electricity would be turned on, expressed their wishes for optimizing the schedules, and so on. The workload on employees who communicated with customers increased tremendously.
Traditional (but not always correct) approach: increase the number of call center employees and SMM specialists.
A laconic approach: a series of infographics that answer customers' questions.
The infographics helped to answer common customer questions and explained the problems Yasno has to deal with: how quickly supplies are restored after shelling, why electricity is cut off beyond of the schedule, how everyone can reduce the electricity shortage on their own, whether Russia can turn off all the electricity in Ukraine, etc.
This series of infographics has received over 19 million views. For comparison: the population of Ukraine before the full-scale invasion: 40 million people.
An infographic showing how quickly energy company employees restore electricity supply after shelling
4. Communication of investment needs
Traditional (but not always correct) approach: a voluminous report.
A laconic approach: one infographic in a specialized study.
When there is no time and resources to prepare voluminous content, simple formats can help, for example, one page of infographics describing problems, needs, plans, achievements, etc. The company can then use it at its discretion, adapting it to its formats and needs, for example, to use it at conferences, business meetings, and future reports.
Our latest research, Russia-Ukraine War: Environmental Impact, includes case studies of two companies: Nibulon, an agricultural holding company that needs to invest in equipment for demining fields, and DTEK, which explains its investments in green energy.
5. Explain the company's digital transformation
Traditional (but not always correct) approach: a voluminous report or a series of interviews.
A laconic approach: one infographic in a specialized study.
We have been preparing an infographic study on digital transformation for several years: we explain what it is and show trends, technologies, and case studies. Several companies that actively communicate their transformation processes were featured in this study. For example, the pharmaceutical company Darnitsa, Kernel, one of the largest agricultural holdings in Ukraine, and Interpipe, a group operating in the steel industry.
6. Communication with lawmakers and society
Traditional (but not always correct) approach: a series of meetings and interviews.
A laconic approach: a small brochure with infographics.
Citizens, the media, and even MPs need help understanding most of the issues they have to deal with and evaluate daily. Visual content provides a fantastic opportunity to immerse the audience in an unknown and complex topic quickly. A few years ago, we prepared a brochure about the benefits and opportunities offered by the draft law on localization of production in the machine building industry.
One Ukrainian TV channel showed a page from the brochure.
7. A soy product manufacturer shows the production process
Traditional (but not always correct) approach: video.
Laconic approach: infographics on the website.
For AdamPolSoya, we visualized the production process. In this case, infographics are much less resource-intensive content than video, which requires to choose the right time, needs a scriptwriter, cameraman, and editor .
Conclusion
With this article, we didn't mean to say that large content formats like reports, videos, and presentations have become unnecessary. But there are many cases when it is inappropriate to spend time on them because the same task can be accomplished with smaller formats and the free resources can be directed to other tasks.
In addition, small content units can be easily integrated into larger ones and thus actually do some of the work in advance.
For more examples of effective content, please visit our LinkedIn page. Follow us!